
NOTE: With the growing amount of functionality in GGIR we have decided to migrate the narrative documentation to the GitHub pages of GGIR. This to ease maintenance and accessibility. Therefore, many of the sections in this vignette have been replaced by a link to their new location.
Introduction
Setting up your work environment
GGIR shell function
This section has been migrated to this section in the GGIR github-pages, which is now the main documentation resource for GGIR.
Key general arguments
You will probably never need to think about most of the arguments listed above, because a lot of arguments are only included to facilitate methodological studies where researchers want to have control over every little detail. See previous paragraph for links to the documentation and how to find the default value of each parameter.
The bare minimum input needed for GGIR is:
Argument datadir allows you to specify where you have
stored your accelerometer data and outputdir allows you to
specify where you would like the output of the analyses to be stored.
This cannot be equal to datadir. If you copy paste the
above code to a new R script (file ending with .R) and Source it in
R(Studio) then the dataset will be processed and the output will be
stored in the specified output directory.
Below we have highlighted the key arguments you may want to be aware of. We are not giving a detailed explanation, please see the package manual for that.
-
mode- which part of GGIR to run, GGIR is constructed in five parts with a sixth part under development. -
overwrite- whether to overwrite previously produced milestone output. Between each GGIR part, GGIR stores milestone output to ease re-running parts of the pipeline. -
idloc- tells GGIR where to find the participant ID (default: inside file header) -
data_masking_strategy- informs GGIR how to consider the design of the experiment.- If
data_masking_strategyis set to value 1, then check out argumentshrs.del.startandhrs.del.end. - If
data_masking_strategyis set to value 3 or 5, then check out argumentsndayswindow,hrs.del.startandhrs.del.end.
- If
-
maxdur- maximum number of days you expect in a data file based on the study protocol. -
desiredtz- time zone of the experiment. -
chunksize- a way to tell GGIR to use less memory, which can be useful on machines with limited memory. -
includedaycrit- tell GGIR how many hours of valid data per day (midnight-midnight) is acceptable. -
includenightcrit- tell GGIR how many hours of a valid night (noon-noon) is acceptable. -
qwindow- argument to tell GGIR whether and how to segment the day for day-segment specific analysis. -
mvpathresholdandboutcriter- acceleration threshold and bout criteria used for calculating time spent in MVPA (only used in GGIR part2). -
epochvalues2csv- to export epoch level magnitude of acceleration to a csv files (in addition to already being stored as RData file) -
dayborder- to decide whether the edge of a day should be other than midnight. -
iglevels- argument related to intensity gradient method proposed by A. Rowlands. -
do.report- specify reports that need to be generated. -
viewingwindowandvisualreport- to create a visual report, this only works when all five parts of GGIR have successfully run. Note that the visual report was initially developed to provide something to show to study participants and not for data quality checking purposes. Over time we have improved the visual report to also be useful for QC-ing the data. however, some of the scorings as shown in the visual report are created for the visual report only and may not reflect the scorings in the main GGIR analyses as reported in the quantitative csv-reports. Most of our effort in the past 10 years has gone into making sure that the csv-report are correct, while the visualreport has mostly been a side project. This is unfortunate and we hope to find funding in the future to design a new report specifically for the purpose of QC-ing the anlayses done by GGIR. -
maxRecordingInterval- if specified controls whether neighboring or overlapping recordings with the same participant ID and brand are appended at epoch level. This can be useful when the intention is to monitor behaviour over larger periods of time but accelerometers only allow for a few weeks of data collection. GGIR will never append or alter the raw input file, this operation is preformed on the derived data. -
study_dates_file- if specified trims the recorded data to the first and last date in which the study took place. This is relevant for studies that started the recording several days before the accelerometers were actually worn by participants. This is used on the top of data_masking_strategy, so that it may be combined with the strategies in GGIR.
Key arguments related to sleep analysis
For an explanation on how sleep is detected and the specific role of the various function arguments see section Sleep analysis.
- Arguments related to configuring the sleep detection algorithm:
anglethreshold,timethreshold,HASPT.algo,HASIB.algo,Sadeh_axis, andHASPT.ignore.invalid. -
ignorenonwearif set to TRUE then ignore detected monitor non-wear periods in the detection of sustained inactivity bouts to avoid confusion between monitor non-wear time. - If you want to create a visualisation of how sleep period time and
sustained inactivity bouts match throughout a day then consider
arguments
do.visual,outliers.only, andcriterror. - If you want to exclude the first and last night from the sleep
analysis then used
excludefirstlast. -
def.noc.sleepspecifies how the sleep period time window should be estimated if no sleeplog is used. -
includenightcritMinimum number of valid hours per night (24 hour window between noon and noon or 6pm-6pm). -
data_cleaning_fileto ginore specific nights for specific individuals, see also section Data cleaning file. - If you want the sleep analysis to be guided by a sleeplog (diary)
then check out arguments
loglocationwhich specifies the location of the spreadsheet (csv) with sleep log information. Further, use argumentscolidandcoln1to specify the details of your sleep log structure.
GGIR facilitates two possible sleeplog file structures:
Basic sleep log
This section has been migrated to this section in the GGIR github-pages, which is now the main documentation resource for GGIR.
Advanced sleep log
This section has been migrated to this section in the GGIR github-pages, which is now the main documentation resource for GGIR.
Published cut-points and how to use them
This section has been rewritten and moved. Please, visit the vignette Published cut-points and how to use them in GGIR for more details on the cut-points available, how to use them, and some additional reflections on the use of cut-points in GGIR.
Example call
This section has been migrated to this section in the GGIR github-pages, which is now the main documentation resource for GGIR.
Configuration file
This section has been migrated to this section in the GGIR github-pages, which is now the main documentation resource for GGIR.
Time for action: How to run your analysis?
From the R console on your own desktop/laptop
Create an R-script and put the GGIR call in it. Next, you can source
the R-script with the source function in R:
source("pathtoscript/myshellscript.R")
or use the Source button in RStudio if you use RStudio.
In a cluster
This section has been migrated to this section in the GGIR github-pages, which is now the main documentation resource for GGIR.
Processing time
This section has been migrated to this section in the GGIR github-pages, which is now the main documentation resource for GGIR.
Inspecting the results
GGIR generates the following types of output.
- csv-spreadsheets with all the variables you need for physical activity, sleep and circadian rhythm research
- Pdfs with on each page a low resolution plot of the data per file and quality indicators
- R objects with milestone data
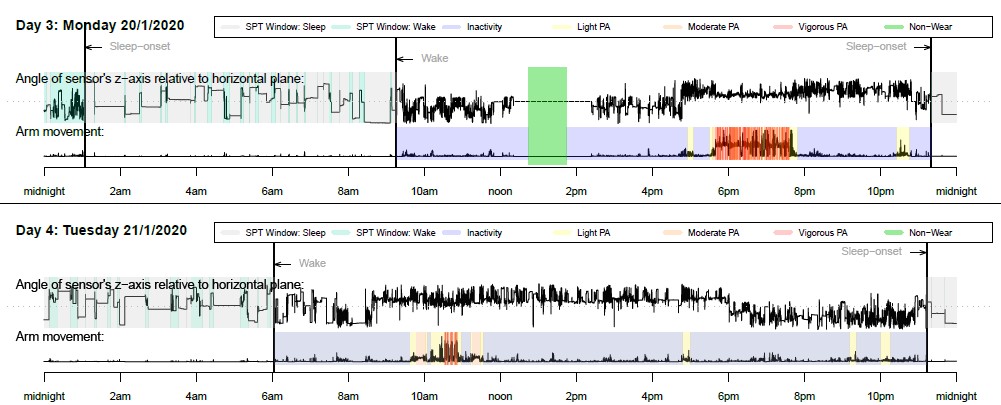
- Pdfs with a visual summary of the physical activity and sleep patterns as identified (see example below)
Output part 2
This section has been migrated to this section in the GGIR github-pages, which is now the main documentation resource for GGIR.
Person level summary
This section has been migrated to this section in the GGIR github-pages, which is now the main documentation resource for GGIR.
Day level summary
This section has been migrated to this section in the GGIR github-pages, which is now the main documentation resource for GGIR.
Data_quality_report
This section has been migrated to this section in the GGIR github-pages, which is now the main documentation resource for GGIR.
Output part 4
This section has been migrated to this section in the GGIR github-pages, which is now the main documentation resource for GGIR.
Night level summaries
This section has been migrated to this section in the GGIR github-pages, which is now the main documentation resource for GGIR.
Non-default variables in part 4 csv report
This section has been migrated to this section in the GGIR github-pages, which is now the main documentation resource for GGIR.
visualisation_sleep.pdf
This section has been migrated to this section in the GGIR github-pages, which is now the main documentation resource for GGIR.
Output part 5
This section has been migrated to this section in the GGIR github-pages, which is now the main documentation resource for GGIR.
Day level summary
This section has been migrated to this section in the GGIR github-pages, which is now the main documentation resource for GGIR.
Person level summary
This section has been migrated to this section in the GGIR github-pages, which is now the main documentation resource for GGIR.
Output part 6
This section has been migrated to this section in the GGIR github-pages, which is now the main documentation resource for GGIR.
Motivation and clarification
In this chapter we will try to collect motivations and clarification behind GGIR which may not have been clear from the existing publications.
Reproducibilty of GGIR analyses
Some tips to increase reproducibility of your findings:
- When you publish your findings, please remember to add the GGIR package version number. All of GGIR are archived by CRAN and available from the archive section on the package website. GGIR has evolved over the years. To get a better understanding of how versions differ you should check the NEWS sections from the package website
- Report how you configured the accelerometer
- Report the study protocol and wear instructions given to the participants
- Report GGIR version
- Report how GGIR was used: Share the config.csv file or your R script
- Report how you post-processed / cleaned GGIR output
- Report how reported outcomes relate to the specific variable names in GGIR
Auto-calibration
This section has been migrated to this section in the GGIR github-pages, which is now the main documentation resource for GGIR.
Non-wear detection
This section has been migrated to this section in the GGIR github-pages, which is now the main documentation resource for GGIR.
Clipping score
This section has been migrated to this section in the GGIR github-pages, which is now the main documentation resource for GGIR.
Why collapse information to epoch level?
Although many data points are collected we decide to only work with aggregated values (e.g. 1 or 5 second epochs) for the following reasons:
Accelerometers are often used to describe patterns in metabolic energy expenditure. Metabolic energy expenditure is typically defined per breath or per minute (indirect calorimetry), per day (room calorimeter), or per multiple days (doubly labelled water method). In order to validate our methods against these reference standards we need to work with a similar time resolution.
Collapsing the data to epoch summary measures helps to standardise for differences in sample frequency between studies.
There is little evidence that the raw data is an accurate representation of body acceleration. All scientific evidence on the validity of accelerometer data has so far been based on epoch averages.
Collapsing the data to epoch summary measures may help to average out different noise levels and make sensor brands more comparable.
Why does the first epoch not allign with the original start of the recording
GGIR uses short (default 5 seconds) and long epochs (default 15 minutes). The epochs are aligned to the hour in the day, and to each other. For example, if a recording starts at 9:52:00 then the GGIR will work with epochs derived from 10:00:00 onward. If the recording starts at 10:12 then GGIR will work with epochs derived from 10:15:00 onward.
Motivation:
- This allows us to have a standardised time grid across recordings to describe behaviour.
- This allows us to calculate behaviour exactly per day or per specified time interval in a day.
If the first 15 minute epochs would start at 9:52 then the next one would start at 10:07, which makes it impossible to make statement about behaviour between 10:00 and 13:00.
Sleep analysis
This section has been migrated to this section in the GGIR github-pages, which is now the main documentation resource for GGIR.
Notes on sleep classification algorithms designed for count data
Replication of the movement counts needed
This section has been migrated to this section in the GGIR github-pages, which is now the main documentation resource for GGIR.
Missing information for replicating movement counts
This section has been migrated to this section in the GGIR github-pages, which is now the main documentation resource for GGIR.
An educated guess and how you can to help optimise the implementation
This section has been migrated to this section in the GGIR github-pages, which is now the main documentation resource for GGIR.
Guiders
This section has been migrated to this section in the GGIR github-pages, which is now the main documentation resource for GGIR.
Daysleepers (nights workers)
This section has been migrated to this section in the GGIR github-pages, which is now the main documentation resource for GGIR.
Cleaningcode
This section has been migrated to this section in the GGIR github-pages, which is now the main documentation resource for GGIR.
Difference between cleaned and full output
This section has been migrated to this section in the GGIR github-pages, which is now the main documentation resource for GGIR.
Data cleaning file
This section has been migrated to this section in the GGIR github-pages, which is now the main documentation resource for GGIR.
Waking-waking or 24 hour time-use analysis
This section has been migrated to this section in the GGIR github-pages, which is now the main documentation resource for GGIR.
Time series output files
This section has been migrated to this section in the GGIR github-pages, which is now the main documentation resource for GGIR.
Day inclusion criteria
The full part 5 output is stored in the results/QC
folder. The default inclusion criteria for days in the cleaned output
from part 5 (stored in the results folder) are:
- For both MM and WW defined days: The valid (sensor worn) time
fraction of the day needs to be above the fraction specified with
argument
includedaycrit.part5(default 2/3). - For MM defined days only: The length of the day needs to be at least
the number of hours as specified by
minimum_MM_length.part5(default 23). Note that if your experiment started and ended in the middle of the day then this default setting will exclude those incomplete first and last days. If you think including these days is still meaningful for your work then adjust the argumentminimum_MM_length.part5.
Important notes:
- No criteria is set for the amount of valid data during the SPT
window, because all we are interested in part 5 is knowing the borders
of the night and we trust that this was sufficiently estimated by part
4. If you disagree then please notice that all the days are included in
the full report available in
results/QCfolder. - This means that argument
includenightcritas used for part 4 is not used in part 5.
The data_cleaning_file argument discussed in Data_cleaning_file also allows you to
tell GGIR which person(s) and day(s) should be omitted in part 5. The
the day numbers to be excluded should be listed in a column
day_part5 as header.
Fragmentation metrics
This section has been migrated to this section in the GGIR github-pages, which is now the main documentation resource for GGIR.
Difference between fragments and blocks:
Elsewhere in the part5 we use the term block. A
block is a sequence of epochs that belong to the same
behavioural class. This may sound similar to the definition of a
fragment, but for blocks we distinguish every behavioural class, which
includes the subcategories such as bouted and unbouted behaviour. This
means that variables Nblock_day_total_IN and
Nblock_day_total_LIG are identical to
Nfrag_IN_day and Nfrag_LIPA_day, respectively.
In contrast, for fragments we may group LIPA and MVPA together when
refering to the fragmentation of PA.
Differences with R package ActFrag:
This section has been migrated to this section in the GGIR github-pages, which is now the main documentation resource for GGIR.
Why use data metric ENMO as default?
This section has been migrated to this section in the GGIR github-pages, which is now the main documentation resource for GGIR.
What does GGIR stand for?
I wanted a short name and not to spend too much time finding it. The abbreviation has lost its functional meaning, which is why we now only use GGIR as the name.
Circadian Rhythm analyses
This section has been migrated to this section in the GGIR github-pages, which is now the main documentation resource for GGIR.
ActiGraph’s idle sleep mode
This section has been migrated to this section in the GGIR github-pages, which is now the main documentation resource for GGIR.
Time gap imputation
This section has been migrated to this section in the GGIR github-pages, which is now the main documentation resource for GGIR.
The importance of reporting idle.sleep.mode usage
This section has been migrated to this section in the GGIR github-pages, which is now the main documentation resource for GGIR.
MX metrics (minimum intensity of most active X minutes)
This section has been migrated to this section in the GGIR github-pages, which is now the main documentation resource for GGIR.
Minimum recording duration
This section has been migrated to this section in the GGIR github-pages, which is now the main documentation resource for GGIR.
LUX sensor data processing
Although GGIR focuses on accelerometer data a few brands come with LUX data.
In part 1 GGIR calculates the peak lux per long epoch at a default resolution of 15 minutes, which can be modified with argument windowsizes. Peak light offers a more reliable estimate of light exposure per time window compared with taking the average. Further, LUX is used in the auto-calibration.
In GGIR part 2 we visualise the LUX values in the qc plot. In part 3 and 4 LUX is not used for sleep classification because relation between light exposure and sleep is weak.
In part 5 we calculate the mean and maximum of the peak LUX per epoch across all waking hours of the day. Here, the mean (peak per epoch) LUX would then indicate average light exposure per time segment, while max peak would indicate the maximum light exposure per day. Further, we calculate the max and mean peak LUX per most active consecutive X hour of the day. This is intended to offer an alternative to LUX exposure during waking hours which relies on correct sleep classification. LUX exposure during M10 may be seen as an alternative if you are unsure whether you can trust the sleep classification in your data set.
Other Resources
- The GGIR package manual provides documentation on individual functions.
- For general questions about how to use GGIR see the GGIR discussion page.
- For bug reports please post them here.
Citing GGIR
A correct citation of research software is important to make your research reproducible and to acknowledge the effort that goes into the development of open-source software.
This section has been replaced by an updated citation instruction
which you can find via R command citation(package = "GGIR")
and by citing the scientific literature corresponding to the specific
functionality you use as discussed in the GGIR documentation.
Copyright for GGIR logo
The copyright of the GGIR logo lies with Accelting (Almere, The Netherlands), please contact v.vanhees@acceleting.com to ask for permission to use this logo.